A Cannabis Operator's Guide to Market Analytics Platforms (2026)
Analytics · By Headquarters · June 12, 2026
Most cannabis operators shopping for a market analytics platform aren't short on options. They're short on clarity about which question they actually need answered. From the outside, the four major platforms look interchangeable: dashboards, market share charts, pricing data, big menu coverage numbers. Underneath, they run on different data, serve different users, and cost very different amounts. A platform an MSO strategy team can't live without can be a bad purchase for a brand that just needs to know which dispensaries to call this week.
This guide maps BDSA, Lit Alerts, Hoodie Analytics, and Headset to the business question each one was built to answer. It isn't a ranking or a critique. All four companies have built something genuinely useful, and the differences come down to fit. If you're a brand, wholesaler, or multi-state operator who hasn't committed to a data tool yet, the goal is to walk into your first demo already knowing what to ask.
First, Understand the Two Data Foundations
Almost every meaningful difference between these platforms traces back to one thing: where the data comes from.
POS-verified transaction data comes from direct integrations with retailers' point-of-sale systems. It records what actually sold, at what final price, in what basket. It's the most accurate data available in the industry, but it depends on retailers agreeing to participate, and market totals are statistical projections built from a panel of participating stores rather than a count of every transaction in the state.
Menu-based data comes from crawling the public dispensary menus consumers already see on Dutchie, Jane, and Weedmaps. It captures what's listed and at what price, refreshed throughout the day, no integration required. That makes it broad and fast. The catch: listed isn't sold. Sales figures derived from menu data are estimates, inferred from inventory changes. Lit Alerts' CEO has put typical accuracy for this kind of methodology at 70 to 90 percent, and the company's own FAQ describes its output as "a compass, not a GPS."
Headset and BDSA are anchored in POS panels (both added menu layers in 2024 and 2025 for breadth). Hoodie and Lit Alerts are anchored in menu data, though Hoodie supplements it with POS, ERP, and seed-to-sale integrations plus foot traffic signals to power its sales models. Neither foundation wins in the abstract. POS data buys precision. Menu data buys breadth and speed. Which one you need depends on what you're trying to learn.
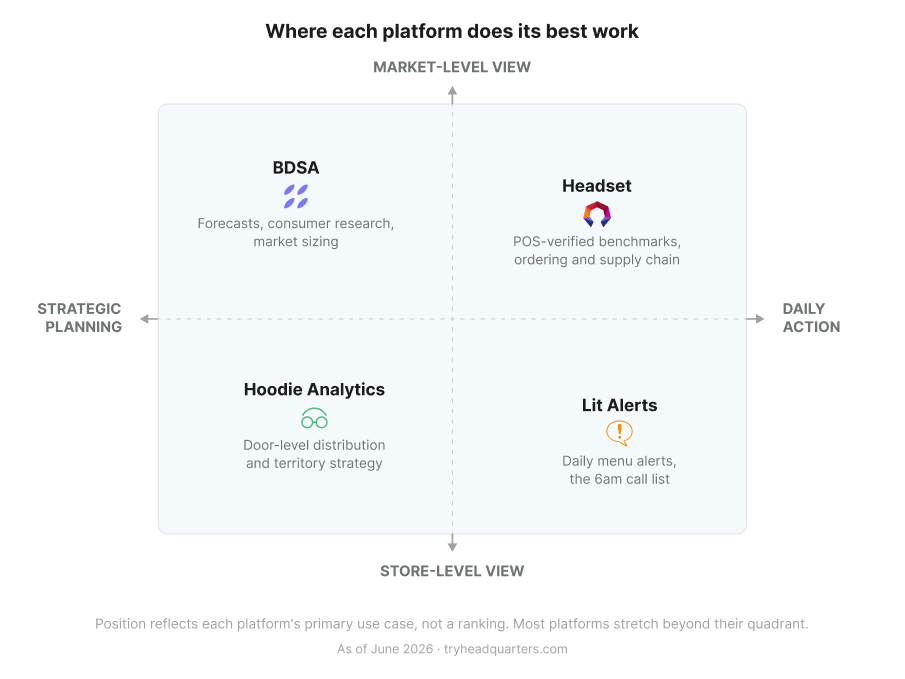
"How big is this market, where is it going, and how does my brand compare at the macro level?" → BDSA
BDSA is a market research firm first and a dashboard second. Founded in 2015 by alumni of the syndicated retail-tracking world (NPD, Leisure Trends), the company set out to give cannabis the same data infrastructure Nielsen and IRI gave traditional CPG, and the product suite still reads that way. The core assets: a POS panel covering 15 U.S. states with daily updates, a twice-annual consumer survey of roughly 20,000 respondents per wave, and a five-year rolling market forecast spanning more than 40 countries, updated quarterly. The metrics are CPG-native too. Velocity, %ACV, share of shelf. If your leadership or your investors grew up reading Nielsen reports, the vocabulary will be familiar.
This is the data most often cited in investor decks and market entry analyses. BDSA's forecasts (the firm projects the U.S. market reaching $44.4 billion by 2029) are reference points across the industry. And its Consumer Insights segmentation sizes not just current consumers but the "Acceptors" who haven't bought yet and say they're open to it. No transaction dataset can give you that demand-side view.
Built for: MSOs planning market entry, investors and lenders sizing opportunities, and brands benchmarking share and category position across states.
Pricing signal: Enterprise subscriptions are custom-quoted. The public reference points are one-time Brand Assessment reports at $3,500, Market Dashboards valued around $3,000 per year (free with NCIA membership), and a free Dispensary Playbook tool launched in late 2025.
You'll know this is your tool if you're making a market entry or capital allocation decision and need numbers that hold up in a boardroom or a diligence process.
"What are competitors pricing and stocking right now — and what changed overnight?" → Lit Alerts
Lit Alerts is the most deliberately simple platform of the four, and that's the point. Launched in Massachusetts in late 2023 and now covering 15 state markets across the Northeast, Mid-Atlantic, and Midwest (plus Nevada), it crawls public dispensary menus throughout the day and converts the changes into one flagship deliverable: a morning email, in your inbox by 6am, listing which accounts went out of stock, which are running low, which competitors dropped prices, and which products are moving suspiciously slowly. The pitch is operational rather than analytical. Your reps have a call list before the 9am stand-up.
Behind the email sits a full dashboard: distribution mapping, competitor price comparisons by store, estimated sell-through velocity, account prospecting filters with CSV export, an embeddable store locator for brand websites, and API access. All of it comes in a single tier. The company is unusually candid about its methodology's limits (estimated data, "a compass, not a GPS"), and equally candid about price, which is rare in this category.
Built for: Brand reps and lean wholesale teams in eastern and midwestern markets who need daily prioritization without an enterprise procurement cycle.
Pricing signal: The transparency outlier. $500 per state market per month, published on the website, with unlimited user accounts, no annual contract, and a 30-day free trial. A LITE alerts-only tier runs about $199 to $200 a month through partner channels like Apex Trading and SpringBig.
You'll know this is your tool if you want competitive intelligence showing up in your inbox every morning, priced so a single won account covers the subscription.
"Which specific dispensaries are moving my product — and my competitors' — and where should my sales team focus?" → Hoodie Analytics
Hoodie Analytics, founded in 2020 in Chicago, applies the CPG measurement playbook one level deeper than the state aggregate: at the individual store. The founding team comes out of IRI, Nielsen, NPD, SPINS, and Numerator, and the platform's signature metrics show it. Weighted distribution tells you what share of a market's dollar volume flows through the doors that carry you. Store-level velocity tells you how fast your product moves where it's actually stocked. Together, those two numbers answer something raw door counts can't: are you in the stores that matter, and are you winning inside them?
The data engine mines menus from more than 10,000 licensed retailers across the U.S. and Canada, roughly 9 million SKUs, and layers in POS and ERP integrations for regression-based sales modeling, plus anonymized foot traffic signals and demographic profiles for every dispensary. The practical output is tactical. Which dispensaries carry your competitors but not you. Which accounts are slipping. Where the next ten doors should be. Hoodie's modeled market data is credible enough that institutional equity research uses it for monthly U.S. market totals.
Built for: Brands focused on sell-in and sell-through, wholesale teams managing multi-state territories, and operators who want CPG-grade distribution metrics down to the individual door.
Pricing signal: No published pricing. The platform is demo-required and appears to be priced per module. Hoodie Connect, its retailer-brand inventory sync product, is free for retailers.
You'll know this is your tool if your bottleneck is territory strategy: knowing which doors to win next and which existing accounts need attention before they churn.
"What's actually selling — verified at the register — and how do I act on it?" → Headset
Headset, founded in 2015 by the team that built Leafly, has the deepest transactional data infrastructure in the industry: roughly 4,000 direct POS connections across more than 30 point-of-sale systems, covering 50 legal markets in the U.S. and Canada. By the company's own measure, about 34 cents of every dollar spent on legal cannabis in North America flows through its platform. A 2025 expansion added 7,000-plus e-commerce menu endpoints, pushing total data sources past 11,000. POS data for precision, menu data for breadth.
Headset also goes further past observation into execution than anyone else in the category. Insights is the flagship intelligence product for brands tracking share, pricing, and category trends from verified transactions, with data current to yesterday. Bridge streams live POS and inventory data from consenting retailers to their brand partners. Bridge Nexus adds AI-generated purchase orders on top of that stream; the company reports an average 19.6 percent reduction in stock-outs, and its mFused case study describes vendor-managed inventory running across 300-plus stores with a 20 percent average sales lift. For enterprise data teams, Vault delivers the normalized dataset straight into a Snowflake warehouse, queryable from Tableau, Power BI, or Python with no ETL work.
Built for: Brands that need POS-verified share and pricing benchmarks, distributors running replenishment at scale, and MSO data teams blending market data with their own.
Pricing signal: A free Retailer tier (premium from $250/month), Bridge from $25/month, and custom-quoted Insights and Vault subscriptions. Headset also publishes a fair amount of free public data, including state pricing benchmarks and its annual 4/20 live sales dashboard.
You'll know this is your tool if you need ground-truth sales data and want to do something with it operationally, not just look at it.
The Same Four Tools, From Your Seat
If the four questions tell you what each tool is, here's what that looks like from where you sit.
"We're a brand planning entry into a new state." Start with BDSA. Market forecasts, category sizing, and consumer adoption data are what an entry decision runs on. Once you're in-market, Headset Insights becomes the operational complement for tracking how the launch actually performs.
"Our reps need to know which accounts to call this morning." Lit Alerts was purpose-built as a daily call-list generator. The 6am email turns hours of manual menu review into a prioritized account list before the workday starts.
"We're live in three states and don't know which doors we're losing." This is Hoodie's home turf. Weighted distribution and store-level velocity show precisely which dispensaries carry your competitors but not you, and which of your existing accounts are decelerating.
"We're an MSO data team that wants market data inside our own warehouse." Headset Vault delivers transaction-level data via Snowflake share with no ETL buildout. BDSA Direct Connect is the equivalent pipe if your priority is forecast and consumer-survey context rather than transactional depth.
"We're a distributor drowning in manual reorder workflows." Headset Bridge and Bridge Nexus are the most developed vendor-managed inventory tools in the category: live retailer inventory plus AI-generated purchase orders, with an ERP integration path through Distru.
Side by Side
A condensed view, with the caveat that coverage figures are company-reported as of mid-2026 and change frequently:
| BDSA | Lit Alerts | Hoodie Analytics | Headset | |
|---|---|---|---|---|
| Core question | How big is the market and how do I compare at the macro level? | What changed on competitor menus overnight? | Which specific doors should my sales team focus on? | What's verifiably selling, and how do I act on it? |
| Data foundation | POS panel + consumer surveys + menu layer | Public menu crawls + ML estimation | Menu mining + POS/ERP integrations + foot traffic | Direct POS integrations + e-commerce menu layer |
| Coverage | 15 states tracked; 40+ countries forecast | 15 states (Northeast/Mid-Atlantic/Midwest + NV); 3,000+ retailers | U.S. + Canada; 10,000+ retailers | 50 U.S./Canadian markets; 11,000+ sources |
| Signature products | GreenEdge, Consumer Insights, Market Forecasts | Daily alert email, Brands Explorer, API | Market Intelligence, Dispensary Analytics, Connect | Insights, Bridge/Bridge Nexus, Vault |
| Pricing signal | Custom; $3,500 one-time reports | $500/state/mo, published | Demo-required | Free–$250/mo retail tiers; custom Insights |
| Calibrated for | Strategy teams, investors, enterprise brands | Sales reps and lean teams | Brand and wholesale territory teams | Brands, distributors, MSO data teams |
How to Actually Choose
Three heuristics cut through most of the deliberation.
Match the tool to your most expensive open question. Not every data gap costs the same. A wrong market entry call costs millions. A missed restock costs a few thousand. If your costliest unknown is strategic (which market, which category, how big), start with BDSA. If it's performance truth (what's really selling, at what price), start with Headset. If it's territory (which doors), start with Hoodie. If it's daily awareness (what changed), start with Lit Alerts.
Match the tool to your team's altitude. These platforms are calibrated for different users at different elevations. BDSA for the boardroom and the deck. Headset for the analyst and the supply chain manager. Hoodie for the sales director planning territories. Lit Alerts for the rep in the field on Tuesday morning. A common buying mistake is purchasing at one altitude and expecting it to serve another.
These aren't mutually exclusive, but watch the overlap. Operators with larger budgets routinely pair them. BDSA plus Headset is the common enterprise stack: macro context plus operational truth. Headset or Hoodie plus Lit Alerts adds a daily alert workflow on top of deeper benchmarks for a relatively small incremental spend. One caution before stacking subscriptions: BDSA and Headset both added daily menu-intelligence layers in 2024 and 2025 that partially overlap with what Hoodie and Lit Alerts do. If you already subscribe to one of the larger platforms, check whether its menu layer covers your need before buying a standalone tool.
And before committing budget at all, use the free entry points. Headset's free Retailer tier, Lit Alerts' 30-day trial, BDSA's Dispensary Playbook. A few weeks inside a platform answers fit questions no comparison guide can.
The Question Comes First
These four platforms are less competitors than four answers to four different questions. The most productive first step isn't booking demos. It's writing down the unanswered question that's costing your business the most money right now, then matching the tool to it. Operators who do that buy once and use the platform daily. Operators who skip it end up with an expensive dashboard nobody logs into.
HQ helps cannabis brands turn market data into marketing and revenue decisions.