7 Nabis Reports Every Cannabis Finance Team Should Be Reviewing Weekly
Accounting · May 14, 2026
Nabis powers a significant portion of cannabis distribution in California, and for most operators, it already contains an enormous amount of valuable data. The challenge for most finance teams isn't access to information - it's turning that information into a clean financial view without spending hours exporting reports and reconciling spreadsheets manually.
Operator-led brands in the $5–20M range feel this constantly. The operational numbers look healthy, sales activity is moving, receivables appear strong - but translating that into a clear understanding of upcoming deposits, margins, retailer payment behavior, and actual cash movement still takes work.
What follows are seven of the most useful finance and operational reports operators can build from their Nabis data each week. Some already exist within the platform in operational form. Others require layering additional calculations or combining multiple datasets.
1. Next Remittance Forecast
This is usually the most important number for finance teams to nail week to week.
The standard cash view inside Nabis provides strong operational visibility into receivables and order activity. Finance teams often need a more refined forecast that also accounts for fees, returns, credits, excise timing, and payment cadence tied to upcoming deposits. For a brand processing $400K/month through Nabis, that difference can reach $60–80K in a typical remittance cycle - meaningful when you're timing payroll or inventory POs.
The calculation isn't necessarily difficult, it just requires pulling together multiple moving pieces consistently:
- Invoices landing in the next remittance window
- Marketplace fees
- Expected returns and credits
- Excise timing
- Deposit cadence
Operators who build this report well make cleaner decisions around payroll timing, inventory purchasing, and cash planning.
2. Real Discount Percentage
Nabis tracks wholesale discounts extremely well from an operational pricing standpoint. Finance teams often need a broader net revenue view that also incorporates credits, free-fill replacements, damage adjustments, and miscellaneous concessions tied to retailer relationships.
Once those additional adjustments are layered in, the true effective discount rate is often materially higher than the standard wholesale discount line alone - a figure showing 8% operationally may translate closer to 14–18% once all downstream adjustments are included.
Calculation: (wholesale discount + credits + miscellaneous discounts) ÷ gross sales, sliced by retailer, by rep, and by SKU. The real value isn't just the percentage itself - it's the follow-up questions it forces: which rep is driving the highest credit volume? Which retailer consistently requires concessions? Which SKU carries the most margin pressure? That's where the more meaningful decisions usually live.
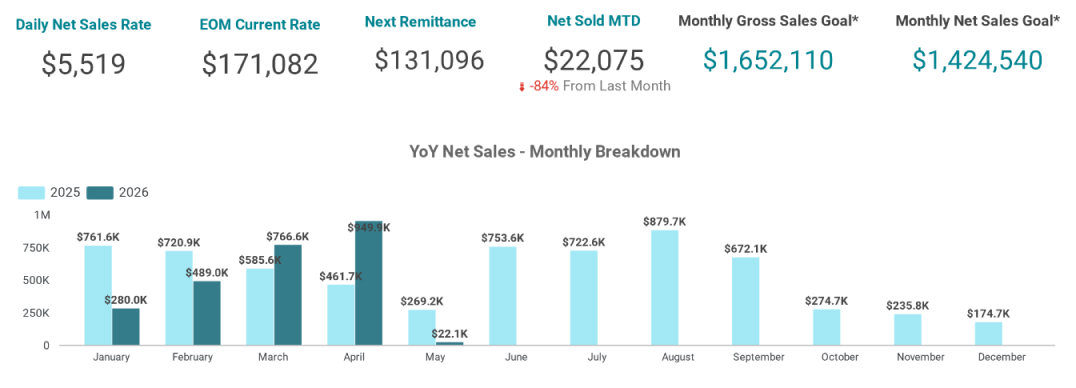
3. Year-Over-Year on Six Key Metrics
Week-over-week data tends to create noise. Year-over-year is the comparison that tells you whether the brand is growing, holding, or quietly shrinking.
The six metrics worth pulling against the same week last year: gross sales, net sales, order discount %, credit %, total discounts, and AOV. Nabis contains the underlying data, but most teams still need to export current and historical periods separately to build the comparison cleanly - which is why most brands can't quickly answer "are we actually growing" without a 20-minute exercise.
Two patterns tend to matter most: AOV down with net sales flat usually signals retailer working-capital pressure. AOV up with order count down usually means SKU mix has shifted. Both are useful indicators long before they become larger financial problems.
4. AR Aging by Retailer
Nabis exposes AR data well operationally. Finance teams benefit from seeing it segmented clearly by aging bucket and retailer behavior: 0–30, 31–60, 61–90, and 90+, sorted by retailer with the 60+ balances prioritized at the top.
California's BPC 30-day payment rule has been on the books since 2022, but many brands still struggle to operationalize collections consistently because the reporting workflow remains manual. Once the data is organized correctly, the collections list usually becomes obvious - five names, often the same five names every month.
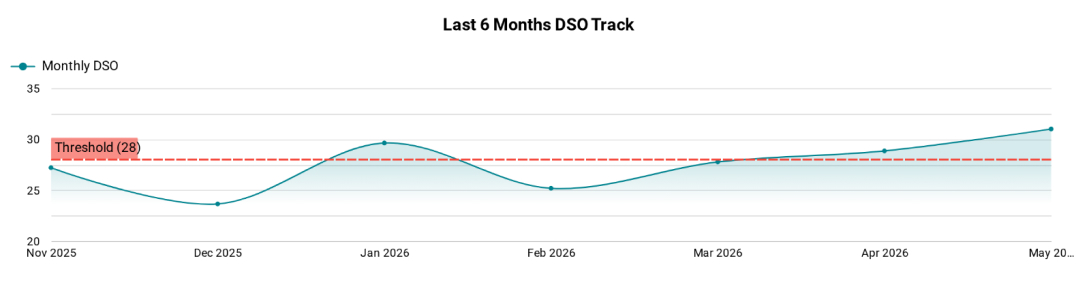
5. Rolling DSO Over 90 Days
Point-in-time DSO snapshots rarely tell the full story. A 90-day rolling DSO is a trend line, and the trend is what matters.
Formula: (AR balance ÷ net sales over the period) × 90. Run it weekly and chart it. A gradual drift from 38 to 45 days over a quarter may not feel dramatic in the moment, but it means the business is quietly financing a substantially larger receivables balance than it was three months ago - and that money has to come from somewhere.
Rolling DSO also tends to be the leading indicator of future remittance pressure. The remittance forecast tells you what's landing next cycle. Rolling DSO helps explain why those deposits may be tightening over time.
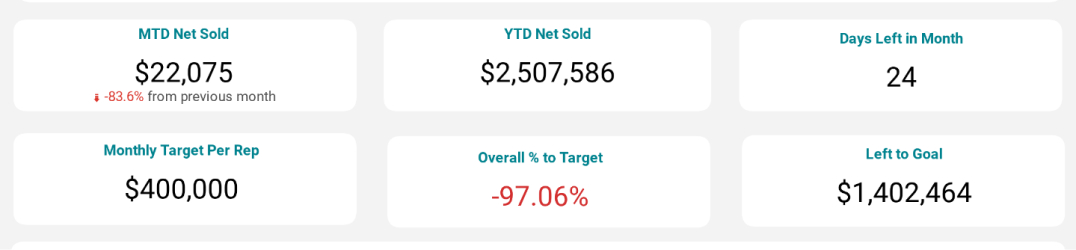
6. Sales Rep Performance vs. Individual Targets
Team averages hide both top performers and underperformance inside the same number. The most actionable version of this report plots each rep's MTD or QTD revenue against their individual quota.
Nabis already surfaces revenue by rep. Layering in quota data - a five-minute addition since the platform doesn't store internal targets - transforms it into a much more actionable management tool. Reps sitting below 70% of target by week three rarely fully recover by month-end.
The report won't tell you whether the issue is coaching, territory allocation, compensation structure, or account mix - but it will tell you where to start looking.
7. Marketplace vs. Rep-Sourced Revenue
Every Nabis order carries an origin tag: marketplace, rep-driven, or reorder. Marketplace orders carry the full Nabis fee. Rep-driven orders carry fully loaded rep costs - salary, commission, benefits, and management overhead.
The exercise: split revenue by origin, apply the effective fee rate to the marketplace portion, and compare against fully loaded rep cost per dollar of revenue. The output helps operators evaluate hiring decisions, marketplace reliance, rep efficiency, and channel strategy. For most founders, this report produces surprisingly different conclusions than expected.
The operational reality
All seven of these reports can be built from data already flowing through Nabis. The challenge for most finance teams is simply bandwidth. Exporting data, normalizing reports, layering calculations, and rebuilding the same spreadsheets every week is a real time commitment - and it's why many teams default to standard portal reporting. Not because the data isn't available, but because operational reporting and finance-ready reporting are often solving slightly different problems.
The operators getting the most value out of Nabis today are the ones building additional reporting layers around the data already inside the platform.
HQ built the Nabis Plug & Play Dashboard specifically for that workflow - packaging all seven of these reports into a single executive summary view, refreshed daily from the Nabis API.
A limited 30-day pilot is currently available for qualified brands.